
Identifying Similarities and Differences
**CLICK ON THE IMAGE NEXT TO EACH STRATEGY TO ACCESS THE PRINTABLE VERSION**
|
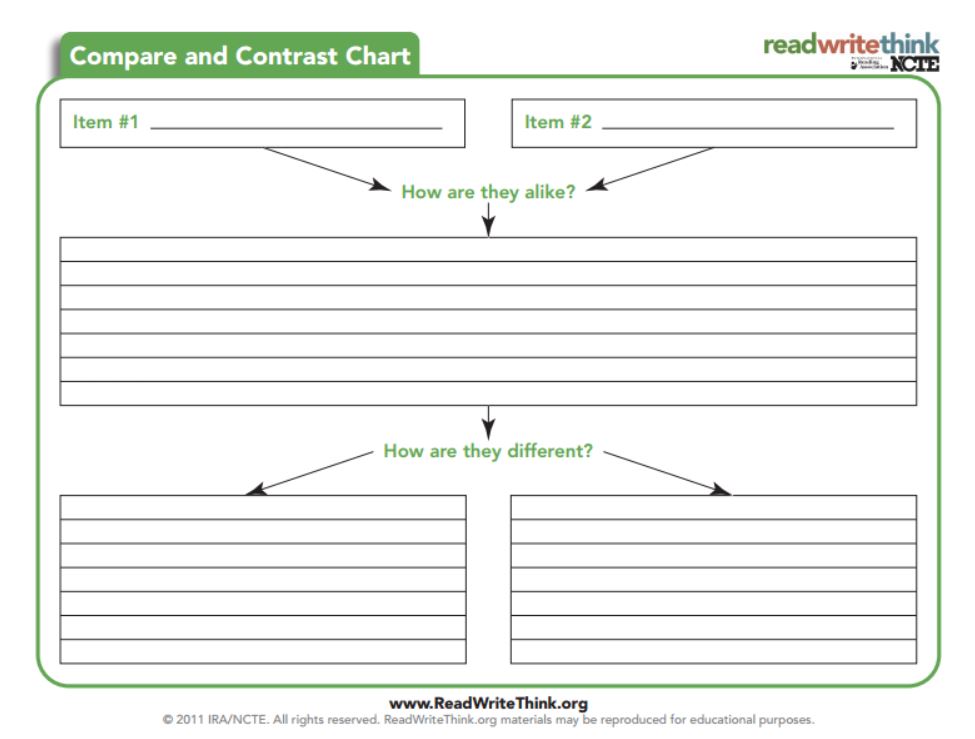
1. Compare and Contrast Graphic Organizer
Basics:
Procedure:
When/Example: See Lesson Section Moore, D. W., & Readence, J. E. (1984). A quantitative and qualitative review of graphic organizer research. Journal of Educational Research, 78(1), 11-17. |
|
|
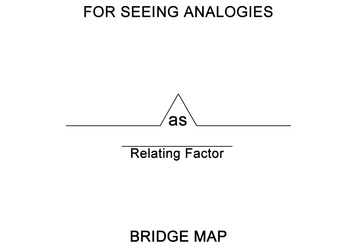
2. Analogy Graphic Organizer
Basics:
Process:
When/Example: This strategy can be used to compare items that are very different but may have a few factors in common. Analogies are one of the more complex strategies to identify similarities and differences. An example where this strategy used could be within literature in order to compare the characters in separate literary works. Plaister, T. (1981). Teaching vocabulary, listening comprehension and reading by means of analogies. Foreign Language Annals, 14(1), 25-29. Retrieved from http://ezproxy.arbor.edu:80/login? url=http://search.proquest.com/docview/63659169?accountid=13998 |
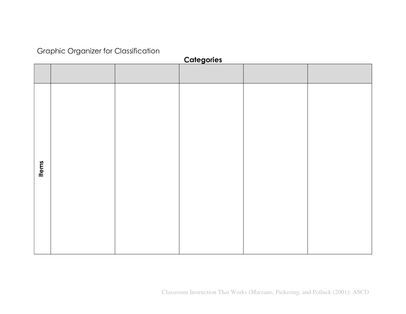
3. Classification Graphic Organizer:
Basics:
Process:
When/Example: This is an applicable strategy for all subject areas. An example where this could be used is within a study of the solar system. The student could classify different types of animals into their groups such as reptiles, amphibians, fish and mammals. The student could use a different type of organizer that uses bubbles instead of columns in order to classify them more specifically from Kingdom all the way to Species.
Chi, M.T.H., Feltovich, P.J., & Glaser, R. (1981). Categorization and representation of physics problems by experts and novices. Cognitive Science, 5, 121-152.
Basics:
- 5-10 minutes
- No particular room arrangement needed.
- Classifying Graphic Organizer
Process:
- The teacher will identify the elements that the student will categorize.
- The student will examine the elements and identify the categories in which they will be classified as. The categories will be written along the top of each column.
- The student will begin putting the elements into the appropriate category.
- The teacher will discuss with students the processes they used to categorize the elements and what categories that they found to be identified within the group.
When/Example: This is an applicable strategy for all subject areas. An example where this could be used is within a study of the solar system. The student could classify different types of animals into their groups such as reptiles, amphibians, fish and mammals. The student could use a different type of organizer that uses bubbles instead of columns in order to classify them more specifically from Kingdom all the way to Species.
Chi, M.T.H., Feltovich, P.J., & Glaser, R. (1981). Categorization and representation of physics problems by experts and novices. Cognitive Science, 5, 121-152.
|
4. Comparison Matrix
Basics:
Process:
When/Example: Although this graphic organizer can be used in many subject areas a specific example where this could be used would be within science to identify the different similarities and differences between different rocks. Students would make observations and then be able to make hypotheses about metamorphic, sedimentary and igneous rocks. Urquhart, V., Frazee, D. (2005). Teaching reading in the content areas: If not me, then who? (5th ed.). Alexandria, VA: ASCD. |

|
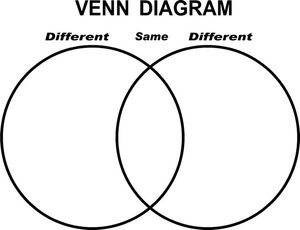
5. Venn Diagram
Basics:
Process:
When/Example: This strategy is so useful and simple for students to use in any subject. An example where this could be used could be within reading. After reading a book, students could compare 2 different characters within the book or could even compare two completely different books that are of the same genre to identify similarities and differences between them.
Encyclopedia Britannica (2014). John venn. Retrieved from http://www.britannica.com/EBchecked/topic/625445/John-Venn
Basics:
- 5 minutes
- No specific room arrangement needed
- Students can have a Venn Diagram Handout or can simply draw 2 circles
Process:
- The student/teacher will identify two items that they desire to compare and contrast.
- The student will write the two items to be compared on top of each circle.
- The students will work independently, small groups, or as a class to identify similarities and differences between the 2 and will write the similarities in the intersecting circle. The differences will be written in the left or right side.
- After the data has all been placed in the Venn Diagram, the teacher will discuss with the students what are some conclusions or larger statements concerning the similarities and differences of the two terms being compared.
When/Example: This strategy is so useful and simple for students to use in any subject. An example where this could be used could be within reading. After reading a book, students could compare 2 different characters within the book or could even compare two completely different books that are of the same genre to identify similarities and differences between them.
Encyclopedia Britannica (2014). John venn. Retrieved from http://www.britannica.com/EBchecked/topic/625445/John-Venn
6. Double Bubble
Basics:
Process:
When/Example: The Double Bubble Organizer could be used within math lessons to compare figures within geometry. Within a geometry unit, the student could compare squares and parallelograms, rectangles and trapezoid. This would help the student identify the features of each shape and to classify them based on their similarities yet recognize the individual shape because of their differences.
Hyerle, D. (2012). Thinking maps. Retrieved December 5, 2013, from Designs for Thinking: Transforming How We See Learning : http://dft.designsforthinking.com/?page_id=17
Basics:
- 5-10 minutes
- No specific room arrangement needed
- Students will need a Double Bubble Graphic Organizer
Process:
- Similar to Venn Diagrams, the teacher will select 2 topics that the students are to compare and contrast.
- The students will use the graphic organizer and label each center circle with the 2 topics chosen.
- Students will begin identifying similar and different features within each topic.
- Similar features will be written in the middle circles that connect to each topic.
- Different features will be written in the non-intersecting circles surrounding the two topics.
- The class/teacher will discuss the data together and state the similar and different features of each topic.
When/Example: The Double Bubble Organizer could be used within math lessons to compare figures within geometry. Within a geometry unit, the student could compare squares and parallelograms, rectangles and trapezoid. This would help the student identify the features of each shape and to classify them based on their similarities yet recognize the individual shape because of their differences.
Hyerle, D. (2012). Thinking maps. Retrieved December 5, 2013, from Designs for Thinking: Transforming How We See Learning : http://dft.designsforthinking.com/?page_id=17
